Boost Your Infrastructure Monitoring in 2025: Discover the Top 10 Zabbix Alternatives You Can’t Miss!

For years, Zabbix has served as a reliable tool for monitoring IT infrastructure. However, with the shift towards hybrid cloud environments, container orchestration, and cloud-native applications, organizations are seeking more versatile and integrated observability platforms. If you’re exploring alternatives to Zabbix that better suit contemporary infrastructure complexities, this guide highlights the top options available in 2025.
What you’ll find in this article:
- An overview of the 10 best infrastructure monitoring platforms that serve as effective replacements for Zabbix in 2025.
- A comparative analysis covering deployment flexibility, cloud and container support, alerting capabilities, and pricing structures.
- Insights into each solution’s strengths, limitations, and the challenges involved in transitioning from Zabbix.
Leading 10 Zabbix Alternatives for Infrastructure Monitoring
- Prometheus paired with Grafana (self-hosted or Grafana Cloud)
- Datadog
- Dynatrace
- New Relic
- Splunk Observability Cloud
- Elastic Observability (Elastic Stack)
- LogicMonitor
- SolarWinds Observability
- Cisco AppDynamics
- Sensu
Comparative Snapshot of Zabbix Alternatives
| Platform | Category | Entry Price (Example) | Best Suited For | Core Advantage |
|---|---|---|---|---|
| Prometheus + Grafana | Open-source / Managed | Free self-hosted; Grafana Cloud starts at $19/month | Cloud-native and Kubernetes monitoring | Advanced querying (PromQL) and highly customizable dashboards |
| Datadog | SaaS Commercial | From $15 per host/month (infrastructure tier) | Quick SaaS deployment with broad integrations | Unified logs, metrics, and traces with extensive ecosystem |
| Dynatrace | SaaS Commercial | Hourly billing; approx. $0.04/hr per host | Full-stack AIOps for dynamic environments | AI-driven root cause analysis and flexible pricing |
| New Relic | SaaS Commercial | Consumption-based; free tier plus paid per data volume | Teams needing unified observability with flexible billing | Strong developer tools and usage-based pricing |
| Splunk Observability Cloud | SaaS Commercial | From $15 per host/month (example) | Enterprise telemetry correlation and compliance | Powerful log-metric correlation and SLA reporting |
| Elastic Observability | Hybrid | Pay-as-you-go serverless options | Organizations leveraging ELK for logs and metrics | Unified agent with search-driven analytics |
| LogicMonitor | SaaS Commercial | Contact vendor; resource-based pricing | Large hybrid infrastructures requiring fast discovery | Extensive integrations and automated asset mapping |
| SolarWinds Observability | Hybrid / Commercial | Modular pricing; contact sales | Hybrid on-premises and cloud monitoring | Enterprise-grade features with modular scalability |
| Cisco AppDynamics | Commercial | CPU-core or unit-based pricing | Application-centric infrastructure monitoring | Deep APM integration with infrastructure context |
| Sensu | Open-source / Commercial | Free OSS for limited nodes; paid enterprise edition | Event-driven monitoring with customizable pipelines | Lightweight, flexible event processing and automation |
Selection Criteria Explained
Our evaluation focused on several critical aspects to ensure each platform delivers practical value without unnecessary complexity:
- Comprehensive telemetry: Ability to gather vital infrastructure data including metrics, logs, events, and traces from hosts, VMs, containers, storage, and network devices.
- Cloud-native readiness: Support for Kubernetes auto-discovery, automated data ingestion, and OpenTelemetry compatibility.
- Ease of operation: Preference for solutions that minimize management overhead through SaaS models, managed services, or lightweight agents.
- Advanced alerting: Features such as alert deduplication, correlation, anomaly detection, and smooth integration with incident management tools.
- Migration friendliness: Capability to run alongside Zabbix and facilitate porting of existing templates, alerts, and dashboards.
- Transparent and scalable pricing: Clear cost structures that grow predictably with infrastructure expansion.
- Strong ecosystem: Availability of exporters, integrations, and active community or vendor support.
1) Prometheus + Grafana
Tailored for cloud-native metrics and flexible querying
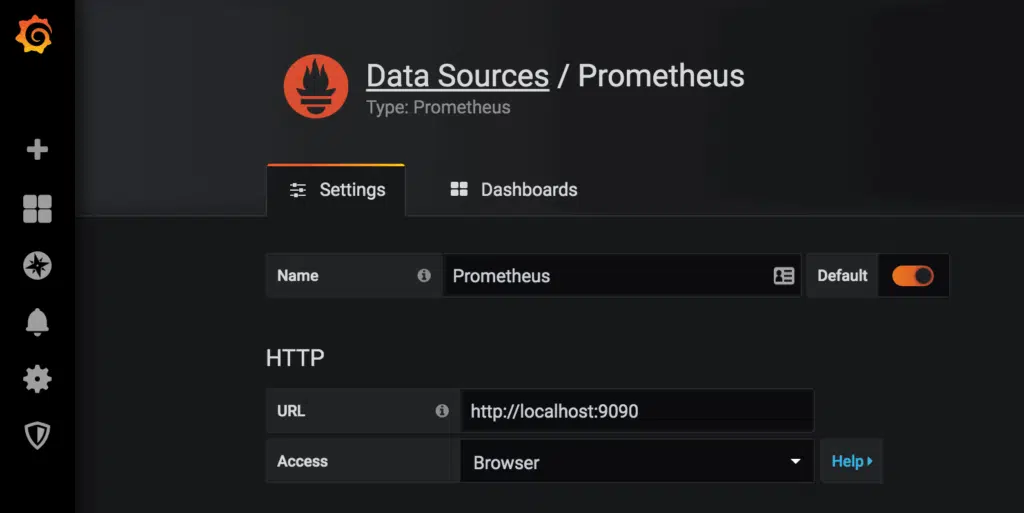
Prometheus has established itself as the go-to solution for time-series data in containerized and cloud-native setups. It scrapes metrics from instrumented endpoints automatically, supports Kubernetes service discovery, and offers PromQL, a powerful query language for crafting precise alerts and service-level objectives. Grafana complements Prometheus by delivering rich visualization options, available as self-hosted or through Grafana Cloud, which also supports logs and traces.
Prometheus shines in providing high-resolution metrics and flexible analysis. Utilizing exporters like node_exporter and kube-state-metrics, it covers hosts, storage, and common services. For extended data retention and multi-tenant environments, additional remote storage or managed services are typically necessary. Grafana enhances this with customizable dashboards and alert routing through various integrations.
Migration tip: Running Prometheus alongside Zabbix is a low-risk approach. Start by monitoring the same hosts to compare alert accuracy. While scaling and durable storage require operational effort, Kubernetes users will see immediate advantages. Traditional data centers may need to deploy exporters and configure retention backends.
Pros
- Industry-standard for metrics and Kubernetes monitoring.
- Highly flexible querying and alerting capabilities.
Cons
- Needs extra components for long-term storage and multi-tenancy.
- Lacks native integration of logs and traces.
2) Datadog
Excellent for swift SaaS deployment and integrated telemetry
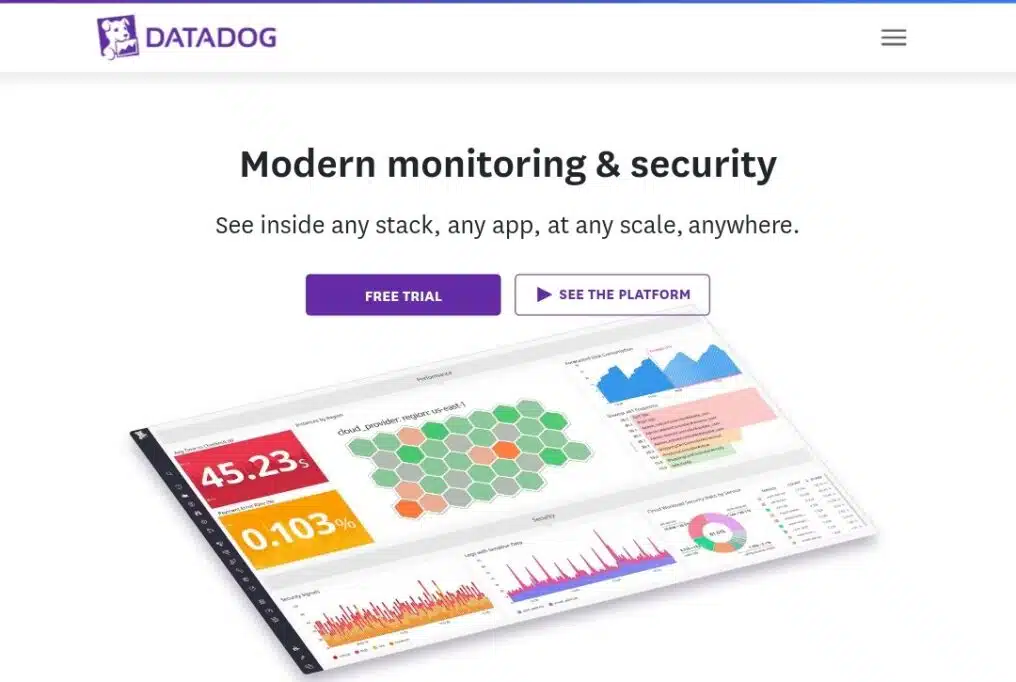
Datadog is a commercial SaaS platform that unifies infrastructure metrics, logs, traces, synthetic monitoring, and network data into a single agent and dashboard. It offers extensive integrations with cloud providers, orchestration tools, and third-party services, along with prebuilt dashboards and monitors that speed up deployment. Its infrastructure tier is favored by teams seeking rapid setup without backend maintenance.
By centralizing telemetry in the cloud, Datadog removes the need to manage databases and collectors. Its alerting system includes anomaly detection and composite monitors to reduce alert fatigue. However, its modular, usage-based pricing can lead to escalating expenses if ephemeral resources are not carefully managed.
Migration advice: Install the Datadog agent on a subset of hosts, replicate Zabbix tagging conventions, and run both systems concurrently for a couple of weeks to compare alerts. Utilize import/export tools to facilitate transition. Budget-conscious teams should analyze data retention and ephemeral host patterns before full adoption.
Pros
- Rapid deployment with broad integration support.
- Unified visibility across logs, metrics, and traces.
Cons
- Costs can escalate with large data volumes and transient hosts.
- Relies on vendor SaaS and stable internet connectivity.
3) Dynatrace
Ideal for AI-driven root cause analysis in complex environments

Dynatrace delivers a full-stack observability and AIOps platform designed for distributed, dynamic infrastructures. It automatically discovers components, maps dependencies, and performs distributed tracing. Its hourly usage pricing suits organizations with elastic workloads. The standout feature is its AI engine, which correlates events to identify root causes, reducing alert noise and speeding up incident resolution.
Infrastructure teams gain detailed insights into containers, VMs, and cloud services, with automated baselining to detect anomalies. Dynatrace minimizes manual setup through auto-instrumentation, providing actionable health and capacity data for scaling decisions.
Migration suggestion: Start monitoring a limited segment with Dynatrace, compare alerts and dashboards with Zabbix, and gradually expand coverage while keeping operational overhead manageable.
Pros
- Strong automated discovery and causal event analysis.
- Flexible usage-based pricing aligned with cloud elasticity.
Cons
- Costs may rise significantly at scale.
- AI insights can sometimes lack transparency.
4) New Relic
Great for flexible consumption billing and unified observability
New Relic offers full-stack observability with a consumption-based pricing model charging for data ingestion and compute rather than host counts. This suits teams with fluctuating workloads. The platform integrates metrics, logs, and traces into a single interface, fostering collaboration between DevOps and SRE teams.
For infrastructure monitoring, New Relic provides automatic host instrumentation, Kubernetes support, customizable dashboards, and a powerful query language, enabling comprehensive monitoring from VMs to cloud-native services.
Migration advice: Begin with a representative sample of services, monitor data volumes and alert patterns, and model costs before scaling to the entire environment to avoid unexpected expenses.
Pros
- Flexible billing and strong developer tooling.
- Unified observability across infrastructure and applications.
Cons
- Data ingestion costs can be unpredictable.
- Requires strict data governance to manage retention and expenses.
5) Splunk Observability Cloud
Designed for enterprises needing deep log and metric correlation
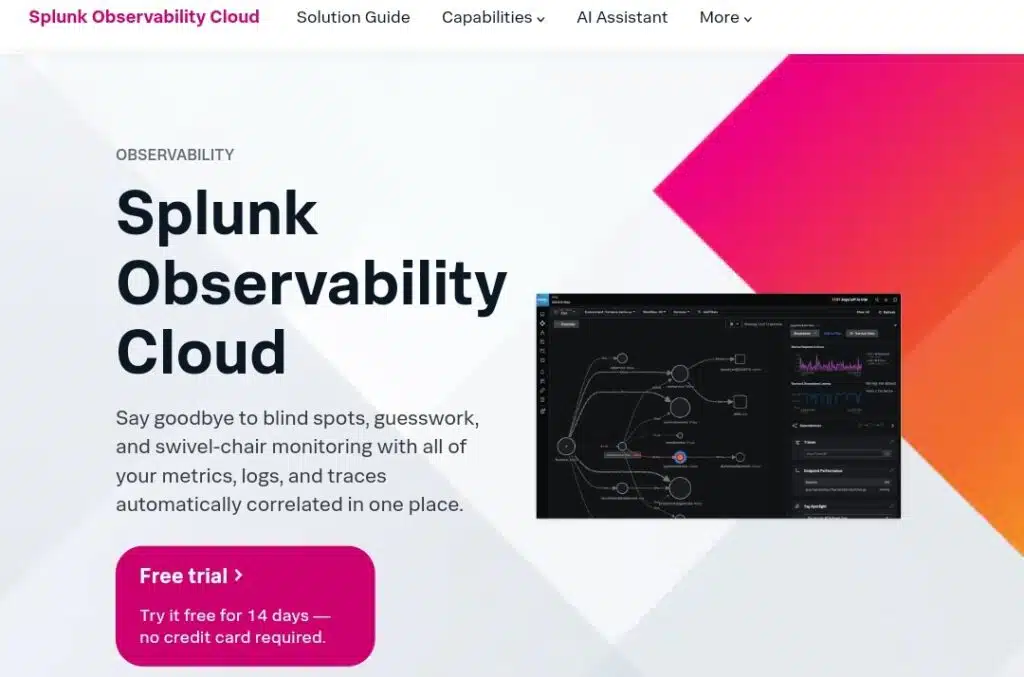
Splunk Observability Cloud excels at managing high-cardinality metrics, logs, and traces with enterprise-grade features for security, compliance, and SLA reporting. Its search-first approach enables deep forensic analysis across telemetry and business events. Infrastructure teams benefit from tight integration between logs and metric anomalies, accelerating incident response.
Operationally, Splunk ingests data via agents and pipelines, offering dashboards and alerting. It’s often chosen by organizations already using Splunk for security or logging, seeking a unified vendor for observability and SIEM.
Migration considerations: Best suited for large enterprises with compliance requirements. Migration involves adapting log formats, configuring ingestion pipelines, and rebuilding alert logic. Initial costs and engineering effort are higher but justified by the value in correlated telemetry and audit capabilities.
Pros
- Exceptional log-to-metric correlation and search capabilities.
- Enterprise features supporting compliance and SLA management.
Cons
- Potentially high ingestion costs.
- Requires careful planning of indexing and retention policies.
6) Elastic Observability (ELK Stack)
Ideal for teams focused on search-driven observability

Elastic Observability merges logs, metrics, and traces through a unified agent and the Elastic Stack. Teams already using Elasticsearch for search and logging appreciate its consolidation of ingestion, storage, and analytics. Elastic’s serverless options offer pay-as-you-go pricing while maintaining a consistent technology stack.
For infrastructure monitoring, Elastic supports agents for hosts and containers, log ingestion pipelines, and metric collection via Metricbeat. Dashboards are highly customizable. Users can self-host or choose Elastic Cloud for managed scaling and storage.
Migration path: Begin by ingesting sample logs and metrics alongside Zabbix alerts. Elastic is well-suited if long-term retention and searchable logs are priorities. Self-hosting requires expertise in index and cluster management unless using managed services.
Pros
- Unified, search-first analytics across logs and metrics.
- Flexible deployment: self-hosted or managed cloud.
Cons
- Self-hosting demands careful index and cluster management.
- Pricing and sizing can be complex without managed service.
7) LogicMonitor
Perfect for broad hybrid environments with rapid discovery
LogicMonitor is a SaaS monitoring platform that automatically discovers, monitors, and maps hybrid infrastructures, including cloud instances, on-premises servers, network devices, storage, and SaaS applications. It offers a vast integration library and emphasizes ease of onboarding and AI-driven anomaly detection, appealing to teams needing broad coverage with minimal setup.
Operations benefit from agentless discovery for many devices, extensible collectors for complex environments, and prebuilt dashboards for common technology stacks. Pricing is resource-based and typically requires vendor consultation for accurate quotes.
Migration strategy: Deploy LogicMonitor collectors in non-production environments first, validate discovery and mapping, then incrementally apply monitoring policies. This approach usually results in faster onboarding compared to manual Zabbix template creation.
Pros
- Fast discovery with comprehensive hybrid infrastructure support.
- Effective automation and anomaly detection for medium to large enterprises.
Cons
- Pricing requires vendor engagement and may be higher than open-source options.
- Less suited for teams needing deep query customization.
8) SolarWinds Observability
Suited for enterprises seeking modular and scalable monitoring
SolarWinds offers modular observability solutions covering server, application, and network monitoring. It is favored by large organizations seeking granular control, long-term vendor relationships, and the ability to expand capabilities through Orion modules. Both on-premises and SaaS options are available, making it suitable for regulated industries.
Operationally, SolarWinds integrates collectors, probes, and device monitoring with dependency mapping and visualization. Its module-based pricing provides flexibility but requires careful cost management as environments grow.
Migration notes: SolarWinds is ideal for organizations already invested in its ecosystem or requiring on-premises solutions with enterprise SLAs. Migration involves translating Zabbix templates and rebuilding dashboards within SolarWinds modules.
Pros
- Modular design with strong enterprise support.
- On-premises deployment options for compliance requirements.
Cons
- Complex pricing and module-based cost structure.
- Setup and tuning can be resource-intensive.
9) Cisco AppDynamics
Best for correlating application performance with infrastructure health
AppDynamics focuses on application performance monitoring with a solid infrastructure monitoring base. It links application code performance with host and process health, offering deep transaction visibility and business impact insights. This makes it ideal for teams requiring tight integration between infrastructure and application metrics.
Operationally, AppDynamics instruments applications, collects host and container metrics, and provides root cause analysis workflows. Licensing is typically based on CPU cores or units, so cost planning should consider infrastructure size.
Migration approach: Start by instrumenting key services to evaluate transaction tracing, then expand host monitoring. AppDynamics is especially valuable when application latency and business impact are critical to incident management.
Pros
- Comprehensive APM with infrastructure correlation.
- Strong modeling of business transactions.
Cons
- Licensing costs can be high at scale.
- Maximal value requires extensive instrumentation.
10) Sensu
Ideal for event-driven, check-based monitoring workflows
Sensu is built on an event-driven monitoring architecture. Instead of focusing solely on hosts or metrics, it provides a flexible event pipeline that collects checks, processes them via agents, and routes results to alerts or automation workflows. This design suits teams seeking granular control and the ability to create custom remediation and notification processes. Sensu is available as a free open-source project and a commercial enterprise edition.
Its lightweight agents and pipeline-first design enable centralized check management, intelligent handling of noisy alerts, and seamless integration with external systems like Prometheus exporters or third-party metrics backends. Sensu excels in automation, such as triggering scripts to resolve recurring issues without manual intervention.
Migration tip: Transition gradually by replacing specific Zabbix checks with Sensu while maintaining existing alerting systems. Over time, adopt Sensu’s code-driven monitoring approach, which aligns well with infrastructure-as-code practices.
Pros
- Highly flexible event pipeline with strong automation capabilities.
- Open-source option reduces initial costs.
Cons
- Requires upfront design and engineering effort.
- Fewer built-in dashboards compared to SaaS competitors.
Essential Insights
- All the alternatives listed enhance cloud-native monitoring features, including Kubernetes auto-discovery and unified telemetry across metrics, logs, and traces.
- Choosing the right platform depends on your team’s expertise and budget. Open-source tools offer greater control and cost efficiency, while SaaS solutions reduce operational complexity and scale quickly.
Final Thoughts
Although Zabbix remains a dependable monitoring tool, the evolving infrastructure landscape in 2025 demands more sophisticated and flexible solutions.
The platforms reviewed-from Prometheus + Grafana to AppDynamics and Sensu-illustrate that no single tool fits every scenario. Some emphasize cloud-native scalability, others prioritize enterprise compliance, and some focus on event-driven automation.
Your choice should reflect your environment’s needs:
Primarily Kubernetes-based? Explore Prometheus, Datadog, or Dynatrace.
Managing a hybrid enterprise? Consider SolarWinds or LogicMonitor.
Require deep application performance insights? AppDynamics is a strong candidate.
Instead of an abrupt switch from Zabbix, pilot two alternatives side-by-side, evaluate alert accuracy, and assess migration complexity to determine the best path forward.


Leave a Reply